

In 1956, the United States stopped a war. The British, French, and Israelis had seized the Suez Canal. The Eisenhower administration, displeased, did not send troops. It did not even threaten them. Treasury Secretary George Humphrey simply let it be known that the United States would not support sterling in foreign exchange markets. Within days, the pound was collapsing. Within a week, the British government had agreed to withdraw. Niall Ferguson has called Suez the moment the British Empire ended — not on a battlefield, but in the currency markets.
Imperial financial systems do not end the way they begin. They begin with battlefields and treaties. They end with arithmetic. The arithmetic is rarely dramatic. It is almost always quiet. By the time it becomes undeniable, the alternative arrangements have already been built.
The previous essay in this series, The Last Privilege, argued that the net investment income subsidy supporting American economic life for fifty years has now mechanically reached zero. That argument was anchored in a single empirical observation — the BEA net investment income series crossing zero in 2026 for the first time since the structural debtor era began.
This essay does something different. It walks through eleven series in the American external account. Not to make an argument. To show what the data shows. No single series proves the argument. Read together, the pattern becomes harder to ignore.
The American external configuration that prevailed from 1971 to roughly 2010 has been quietly dismantling itself for fifteen years. Each series moves slowly. The collective pattern, read across multiple independent measurements, is the slow unwinding this essay describes.
How credit gets created in America
From 1945 to 2008, private credit creation accounted for the bulk of total credit growth in the American economy. Banks lent against productive collateral. Households borrowed for homes. Firms borrowed for investment. Government credit creation existed, but outside wars and recessions it remained modest, averaging 2–3% of GDP.
That era ended in 2008.
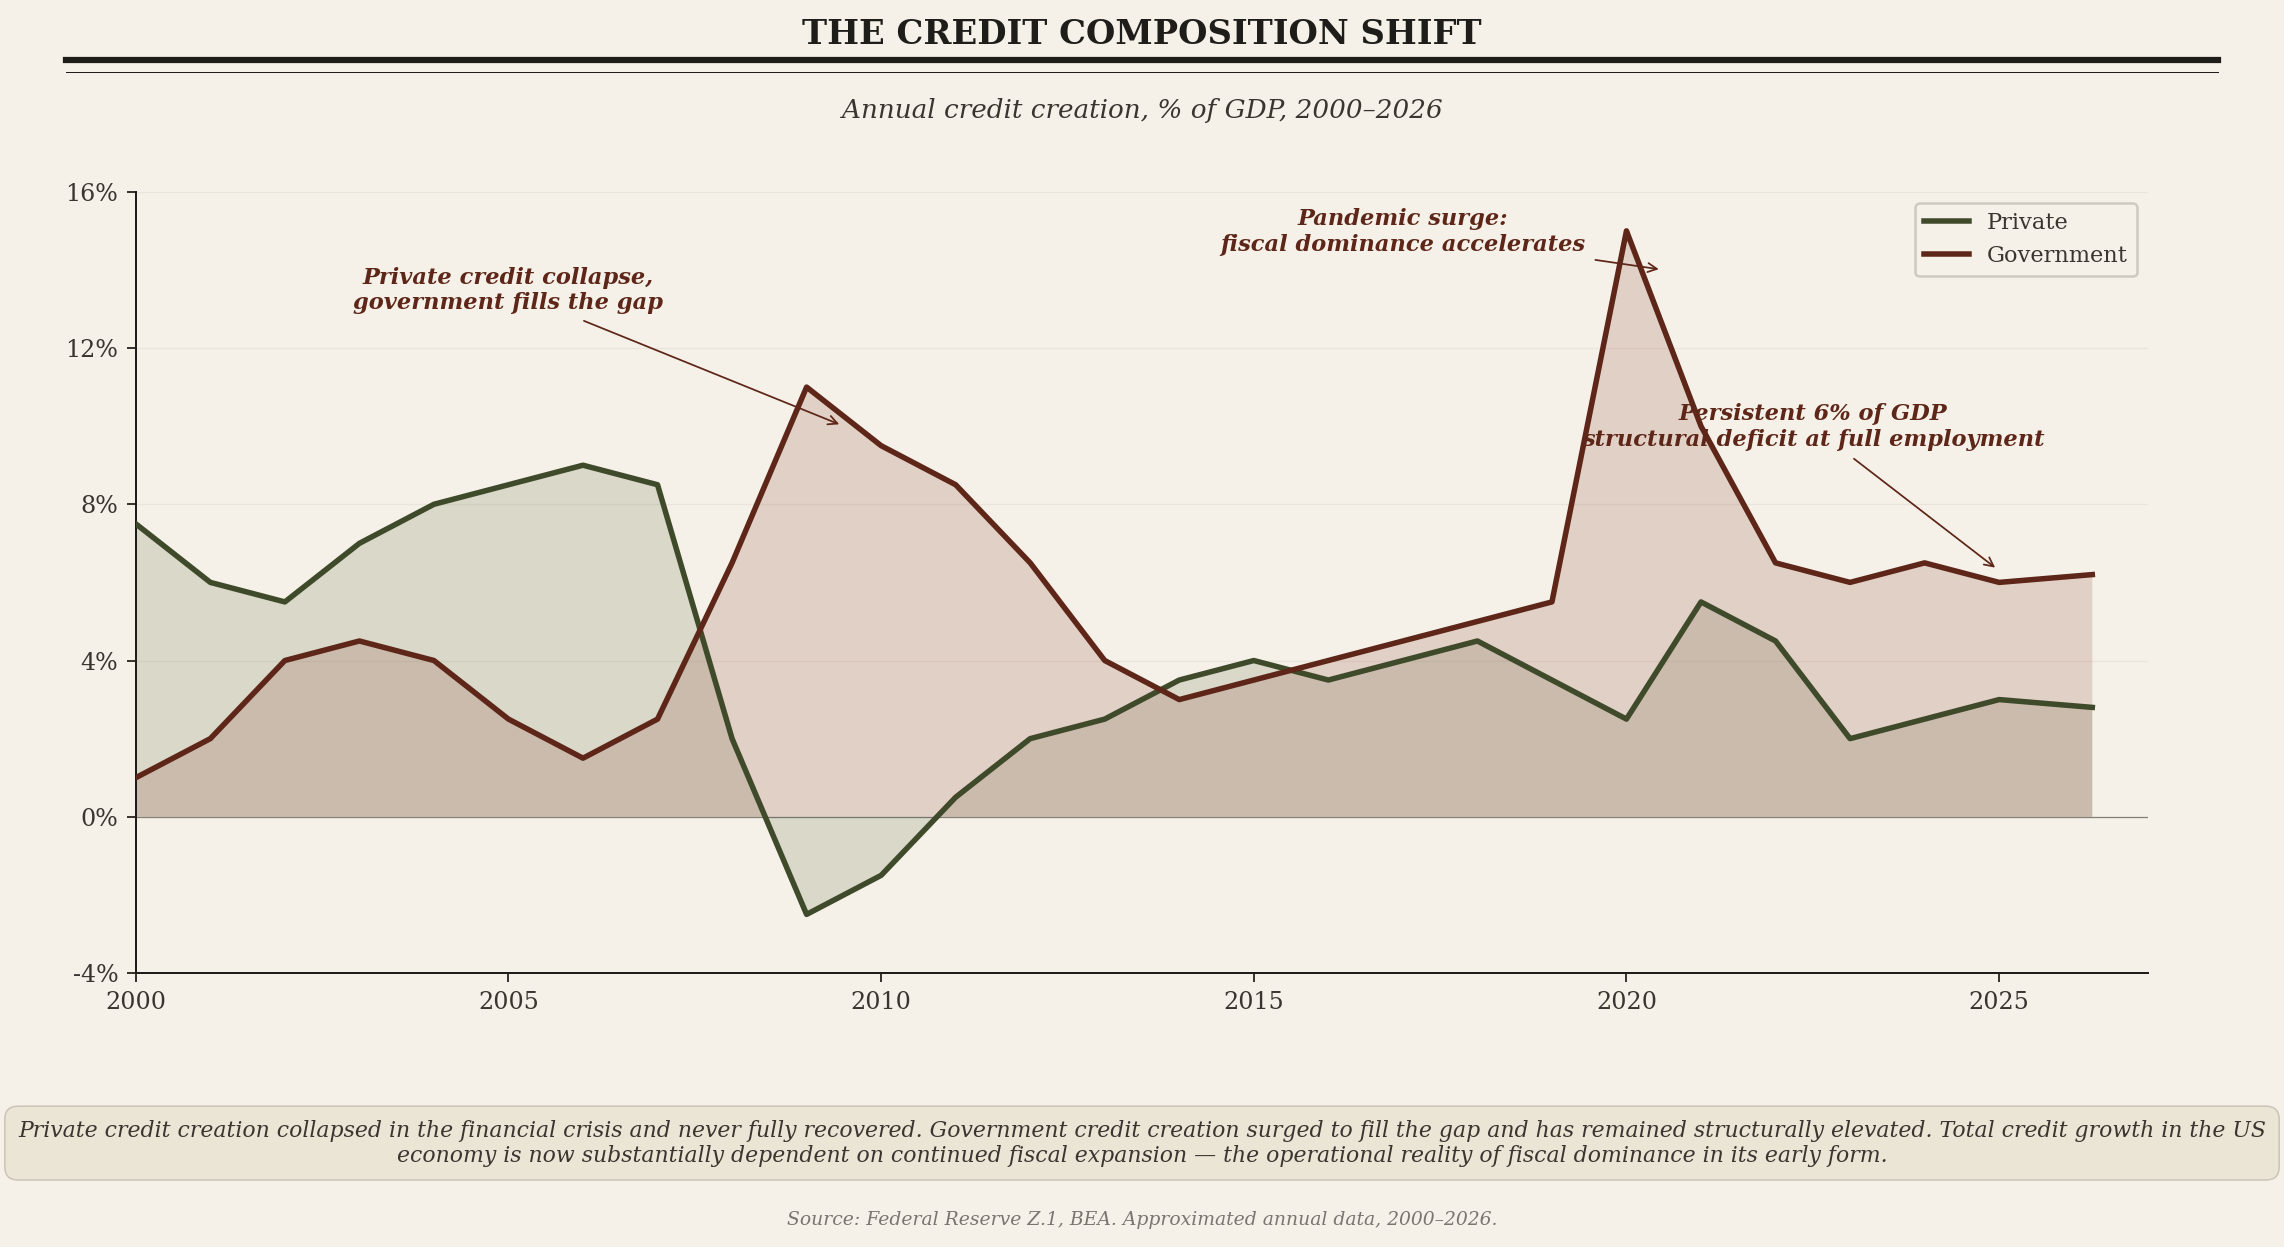
The financial crisis broke the private credit machine. Banks pulled back. Households deleveraged. Private credit creation collapsed and never fully recovered. In its place, government credit creation surged — through TARP, the stimulus packages, and the persistent fiscal deficits of the post-crisis decade.
The Federal Reserve adapted through specific operational choices: zero interest rate policy held for seven years, three rounds of quantitative easing that absorbed approximately $3.7 trillion of Treasury and mortgage-backed securities, and explicit duration suppression through forward guidance. These tools compressed term premium to negative readings for the first time in the modern era. They did not durably revive private credit. They did inflate asset prices and enable the federal government to carry unprecedented debt without crushing interest expense.
Then came the pandemic. The fiscal response — across both administrations — was the largest peacetime expansion in American history. Government credit creation spiked to 15% of GDP in 2020. It has remained structurally elevated since. The current federal deficit, six percent of GDP at full employment, is the largest peacetime reading on record.
The composition shift is the operational reality of fiscal dominance in its early form. Total credit growth in the American economy is now substantially dependent on continued government borrowing. Pull back on the fiscal side and total credit collapses unless private credit accelerates to fill the gap. There is no sign that it will.
This matters because the federal government is not just one borrower among many. It is the borrower whose debt the rest of the financial system uses as collateral, as benchmark pricing, and as the foundation of the dollar’s reserve currency role. When the federal government becomes the marginal credit producer, monetary policy operates within new and binding constraints. The Federal Reserve cannot tighten as much as cyclical conditions might warrant because tightening into fiscal-dependent credit creation produces visible stress. It cannot ease aggressively without acknowledging fiscal dominance more explicitly than its framework permits.
Fiscal dominance and external deterioration are not separate phenomena. They are the same phenomenon viewed from different sides of the national accounts. Structural domestic fiscal deficits drive aggregate demand higher than domestic production can satisfy. The excess is met through imports. Imports produce the current account deficit. The current account deficit, by accounting identity, requires offsetting capital inflows. Those inflows accumulate over time into the negative net international investment position.
The mechanical identity that frames everything
A country’s current account deficit must be financed by net capital inflows. This is not a theory. It is accounting.
The United States has run a structural current account deficit since the early 1980s. The deficit currently sits at roughly 3.4% of GDP. That deficit cannot exist without offsetting capital inflows of the same magnitude. There is no choice about whether the inflows happen. There is only choice about what form they take — Treasury purchases, equity inflows, foreign direct investment, real estate, or currency depreciation that closes the gap.
For decades the capital inflows happened automatically. Foreign central banks accumulated dollar reserves systematically. Trade surpluses from China, Japan, Germany, and the Gulf states were recycled into US Treasuries. The dollar held its value. The system cleared without strain. From 2000 to 2014, global foreign exchange reserves grew from approximately $2 trillion to $13 trillion, with the bulk flowing into dollar-denominated assets.
That automatic accumulation has ended. The 2014 Crimea sanctions made Russia diversify away from dollars. The 2022 freezing of Russian central bank assets after the Ukraine invasion demonstrated that dollar reserves carry political risk even for sovereign holders. China has gradually reduced its share since 2014. Saudi Arabia and other Gulf states have shifted toward gold and alternative assets. Turkey ran an explicit gold-accumulation program. India has done the same more quietly.
The composition of total US capital inflows has shifted to compensate. Where official flows once dominated, portfolio flows from private investors now do most of the work. Pension funds. Sovereign wealth funds. Foreign banks. High-net-worth individuals.
This composition shift matters enormously. Foreign central banks bought Treasuries because their mandate required them to hold dollar reserves. They were price-insensitive buyers. Private investors buy Treasuries because the yield is attractive relative to alternatives, the dollar is expected to hold value, and the return-on-risk calculation works. They are price-sensitive buyers. When the calculation changes, private flows redirect quickly.
This is not a minor distinction.
Official flows accumulated steadily because they were mandated. Private flows arrive only on favorable terms and depart immediately when terms shift.
A current account deficit financed by price-insensitive official accumulation is structurally stable. A current account deficit financed by price-sensitive private capital is structurally fragile.
The system remains stable until the financing cohort decides stability is no longer adequately compensated.
The system still clears. The current account deficit gets financed. But the financing now happens at higher yields than the official accumulation era required, with more volatility, and with greater sensitivity to changes in expectations. The consequences are visible in bear steepening, elevated term premium, and the persistent disconnect between Fed easing and long-end Treasury yields.
This is the operational reality of the slow unwinding. The system functions. The conditions under which it functions have changed.
The position and the privilege
The cumulative result of decades of current account deficits is visible in the net international investment position.
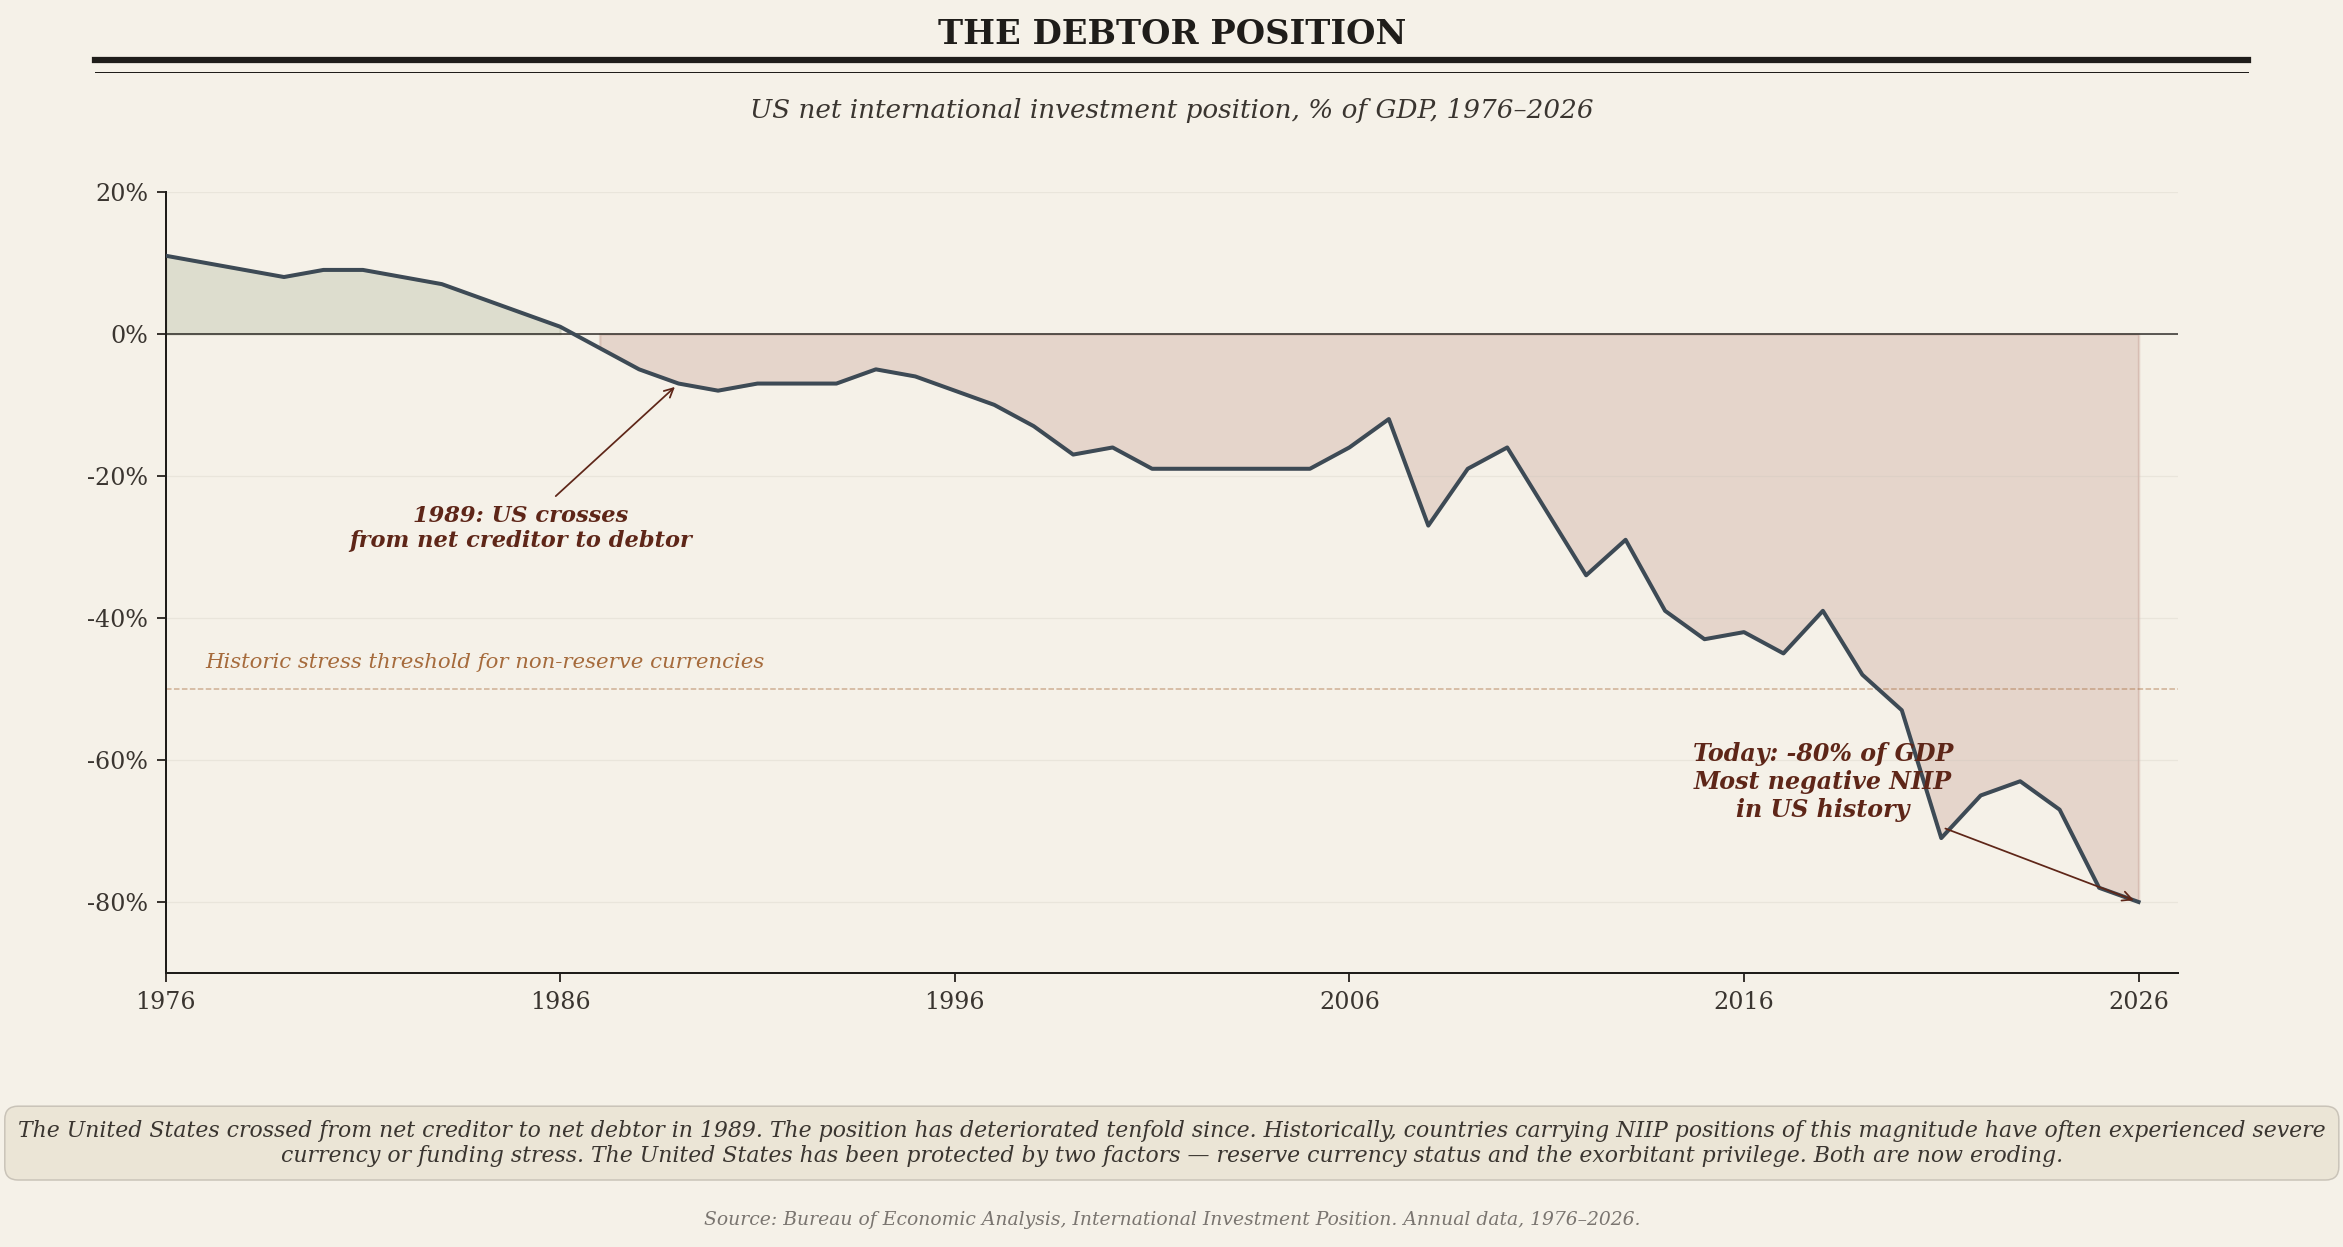
The NIIP measures total US-owned assets abroad minus total foreign-owned assets in the United States. A positive number means net creditor. A negative number means net debtor.
The United States crossed from creditor to debtor in 1989. The moment received almost no public attention. Within five years, the position had deteriorated to -10% of GDP. Within fifteen years, to -20%. Within twenty-five years, to -50%.
Today it stands at approximately -90% of GDP (specifically -$27.5 trillion against ~$30 trillion GDP at end-2025). The most negative reading in American history, and among the most negative readings of any major economy — comparable to Spain (-65%) and Australia (-50%), and worse than any G7 peer. One caveat is worth noting: US external assets are concentrated in equities and FDI, while US external liabilities are concentrated in debt. Dollar depreciation mechanically improves the NIIP because foreign-currency assets appreciate in dollar terms. The position would be modestly worse without recent dollar weakness. The structural trajectory remains unmistakable regardless.
A net debtor position approaching 90% of GDP would, in any other country, produce currency crisis dynamics. Historically, countries carrying NIIP positions of this magnitude have often experienced severe currency or funding stress. Argentina at -60% in 2001. Greece at -100% in 2010. Turkey at -50% in 2018. None of these are perfect analogs to the American case — reserve currency issuers are structurally different from EM sovereigns and from peripheral euro members. But the historical pattern is established: external positions of this magnitude have rarely been carried without crisis.
The United States has been protected by two factors. First, reserve currency status — the dollar’s role as the global settlement and reserve asset created automatic demand for dollar liabilities that prevented the usual debtor-country pressures. Second, the exorbitant privilege — despite being a net debtor, the United States earned positive net investment income because of the yield asymmetry between debt-heavy US liabilities to foreigners (paying low yields) and equity-heavy US assets abroad (earning high returns).
The exorbitant privilege has now closed.
Net investment income averaged +0.7% of GDP for fifty years. It peaked above +1.5%. It has now mechanically reached zero. The previous essay documented the mechanism: yield differentials compressing as US borrowing costs rose and foreign equity returns stagnated. The chart shows the gradual compression through the 2010s and the final crossing in 2026.
The first protection — reserve currency status — is also eroding, more slowly but unmistakably. The share of Treasury securities held by foreign holders has declined from approximately 49% in 2011 to 33% today. Foreign holders still hold roughly $9.4 trillion of Treasuries in absolute terms. But the share of outstanding supply that foreign demand absorbs has fallen by roughly a third over fifteen years.
The Dutch in the 1780s, the Spanish in the 1620s, the British in the 1920s — each empire at the equivalent stage of its financial transition showed echoes of similar patterns. Persistent structural deficits. Eroding foreign demand for the reserve currency. Mounting absolute debt that productive capacity could not service from organic growth. In each case, the empire continued to function for a decade or more after the structural pattern became clear. In each case, the eventual transition was gradual until it wasn’t.
The three measurements of the dollar
The dollar cannot be measured by a single metric. What the dollar is doing depends entirely on what you measure it against.
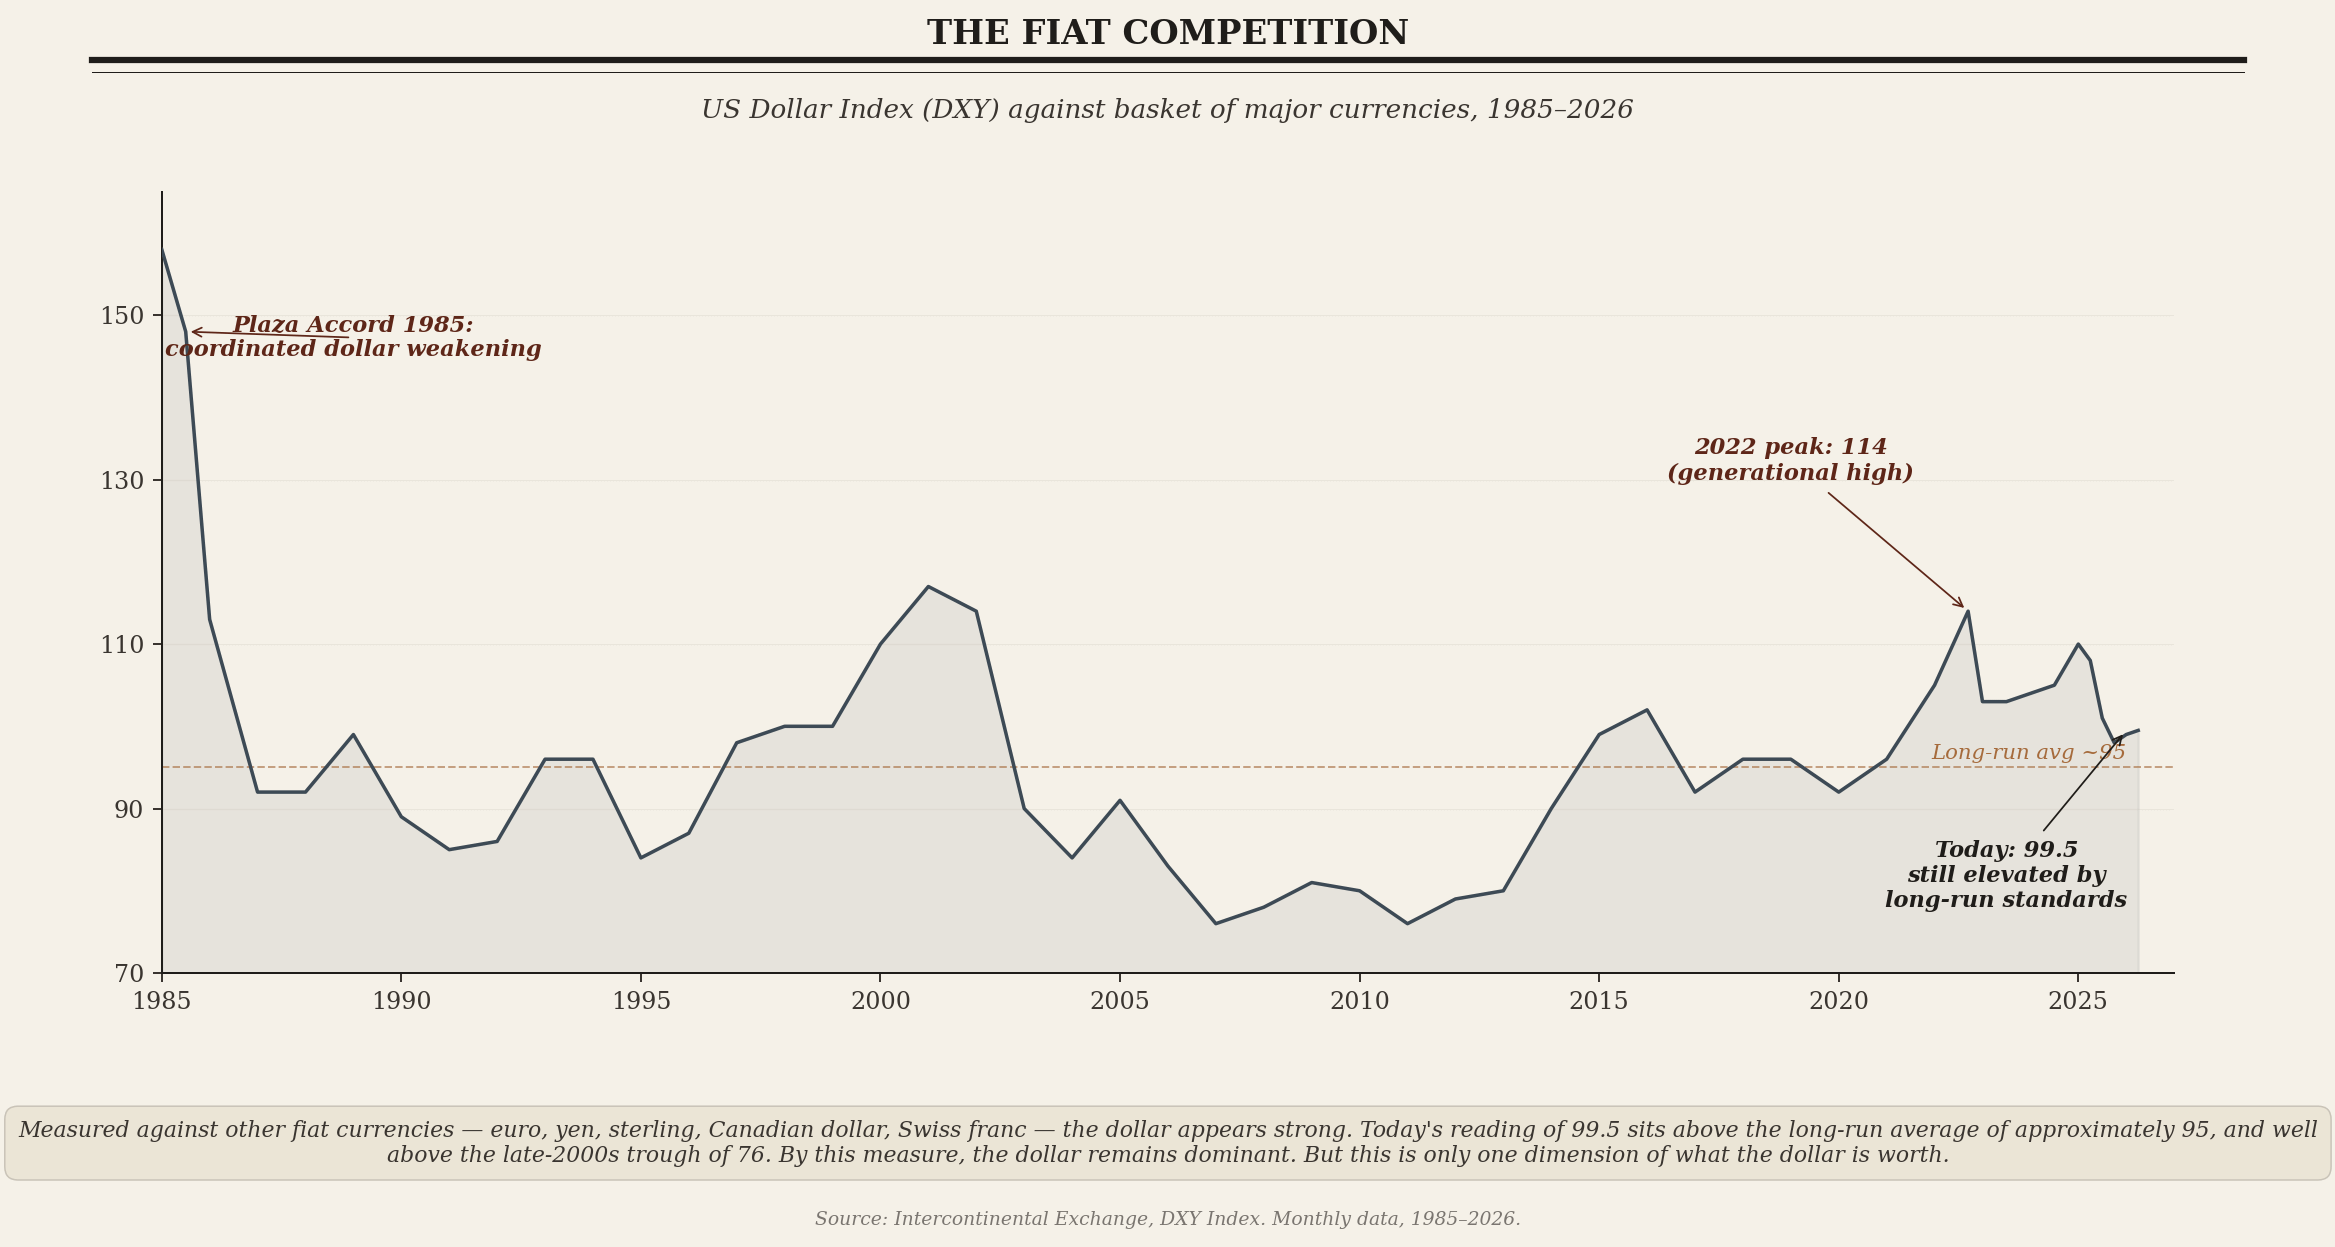
The most-followed measure is the Dollar Index, or DXY, which tracks the dollar against a basket of major currencies — euro, yen, sterling, Canadian dollar, Swiss franc, Swedish krona. By this measure, the dollar appears strong. Today’s DXY around 99.5 sits above its long-run average and well above the late-2000s trough near 76. The 2014–2017 strengthening cycle, the 2022 peak above 114, and the recent retreat have all played out within an elevated range by historical standards.
Read this measure alone and the conclusion would be that the dollar remains dominant. The euro is structurally weak. The yen has been weakening for decades. Sterling has never recovered its pre-Brexit position. The Swiss franc is the only major fiat currency that has consistently held value, and Switzerland is too small to matter for global pricing. The dollar is winning the relative game among fiat alternatives.
But the DXY only measures the dollar against other paper currencies. It does not measure the dollar against outside money or real assets.
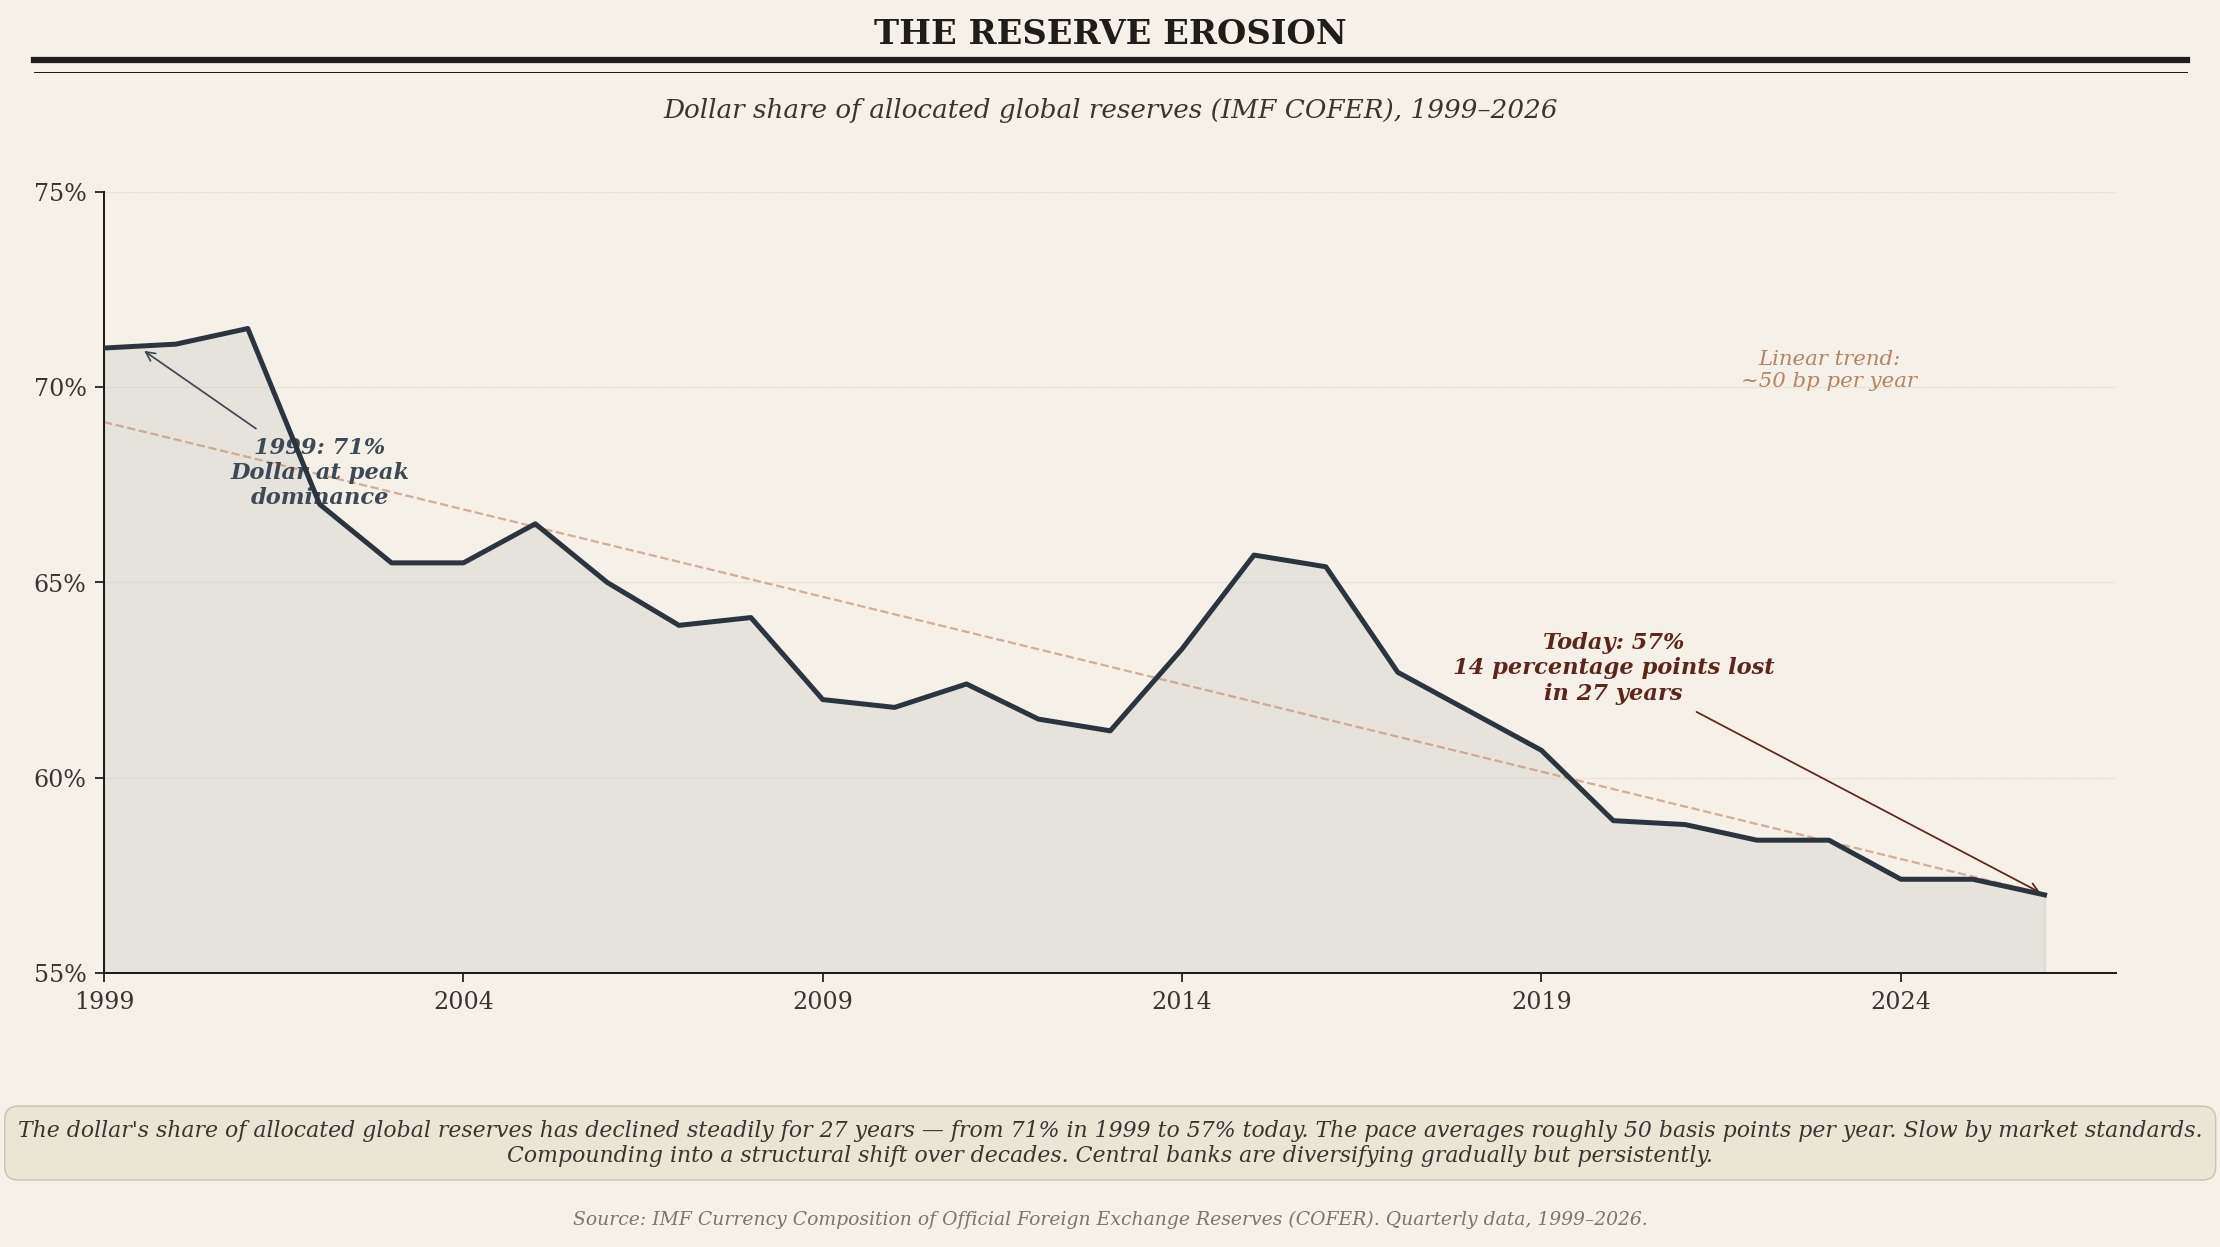
The IMF’s Currency Composition of Official Foreign Exchange Reserves measures the share of allocated global reserves denominated in each major currency. The dollar share has declined from 71% in 1999 to 57% today. Fourteen percentage points lost over twenty-seven years. The pace averages roughly 50 basis points per year. Slow by market standards. Imperceptible from quarter to quarter. Compounding into a structural shift over decades.
Central banks are diversifying. Not aggressively. Not in panic. Persistently. The Chinese central bank’s gold purchases, the Indian central bank’s gold purchases, the Turkish gold accumulation, and the Saudi shift toward alternative assets reflect institutional actors operating on multi-decade horizons. They are also exactly the kind of pattern that, in the historical analog cases, preceded the eventual transition.
The dollar is gradually losing its institutional preference among the central banks that historically anchored its reserve role. The trend has been operating for a quarter century. The acceleration in recent years suggests it may be passing through an inflection point rather than continuing at its historical pace.
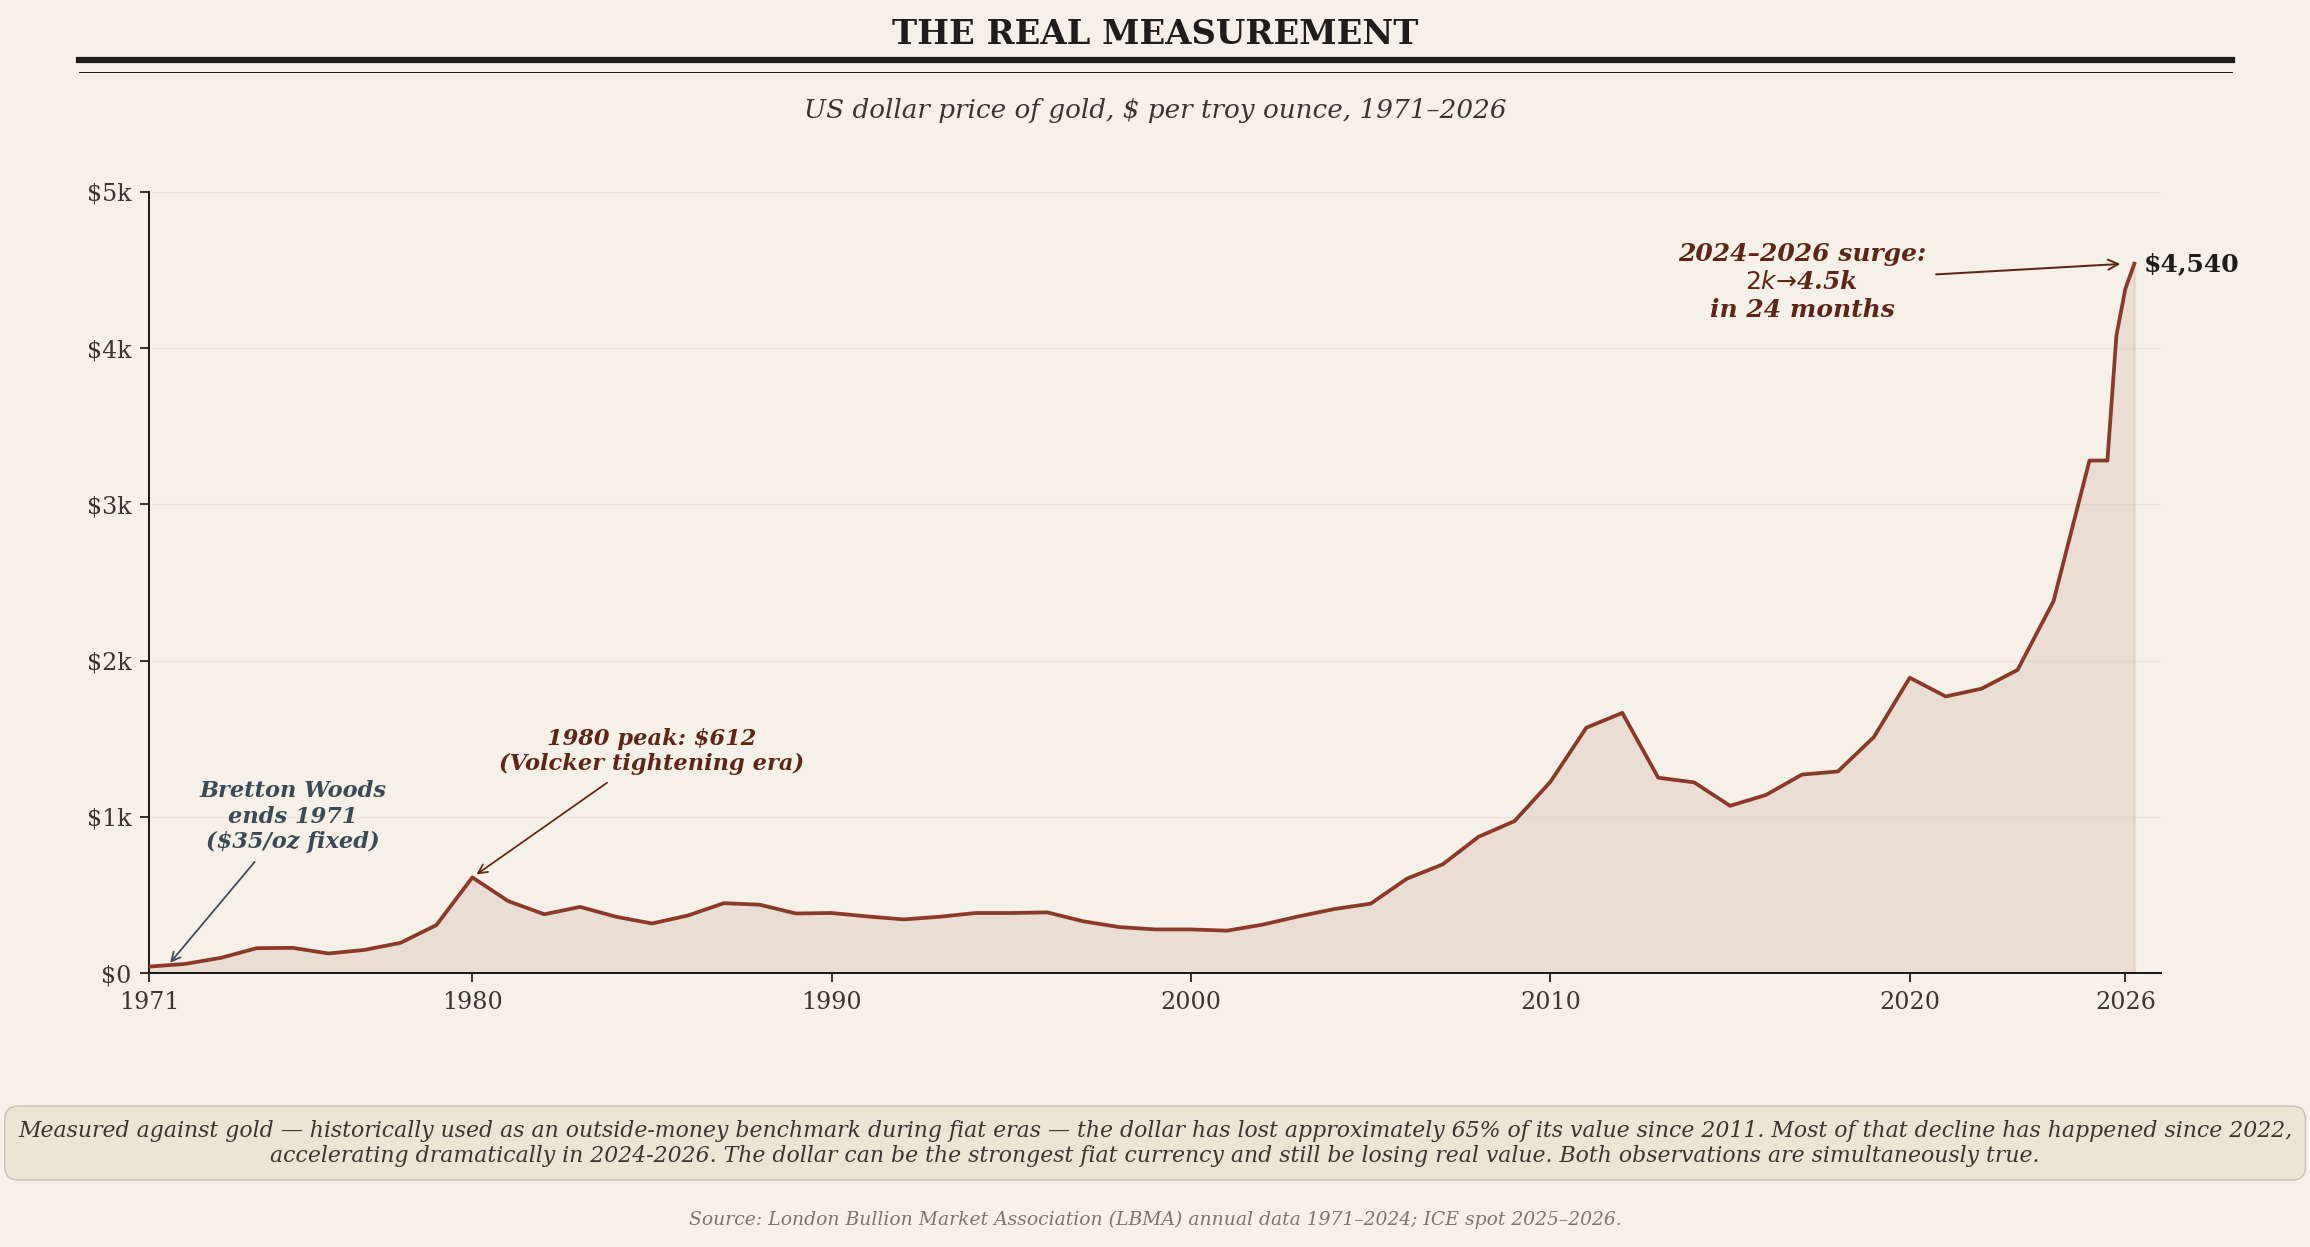
The third measure tells a more dramatic story: the dollar measured against gold.
Gold has functioned as a store of value across centuries, with a supply that grows slowly and that no political authority can expand at will. When central banks accumulate gold, they are exchanging political-discretion fiat reserves for an asset whose value is not subject to monetary expansion decisions.
Measured against gold, the dollar has lost approximately 65% of its value since 2011. Gold traded near $1,570 per ounce in 2011. It trades near $4,540 today. Most of that decline has occurred since 2022, accelerating dramatically in 2024 through 2026.
This is the dimension of dollar weakness that the DXY cannot capture. The DXY would still read 99.5 if every fiat currency in the basket also lost 65% of its value against outside money. The DXY is a relative measure. It tells you which fiat currency is winning the competition among fiat currencies. It does not tell you whether the fiat system as a whole is gaining or losing value relative to scarce assets.
What the three measurements together reveal is the structural reality. The dollar is winning the fiat competition while losing the real-asset competition. Other fiat currencies are weakening alongside the dollar, while gold and other scarce assets are strengthening against all of them. This is the dynamic Ray Dalio describes when he argues that fiat currencies can depreciate together even while one remains dominant within the system.
The dollar can be the strongest fiat currency and still be losing real value. Both observations are simultaneously true.
What the data shows
Eleven series in the American external account. Each one verifiable. Each one independent of the others. Each one pointing in the same direction.
Private credit creation has collapsed since 2008 and never fully recovered.
Government credit creation has risen to fill the gap, now structurally elevated at 6% of GDP at full employment.
The current account deficit sits at 3.4% of GDP and must be financed by offsetting capital inflows.
Foreign official reserve accumulation of dollars has stalled since 2014 and is now often negative at the margin.
The composition of capital inflows has shifted from price-insensitive official flows to price-sensitive private flows.
The net international investment position has deteriorated from +11% of GDP in 1976 to -80% today — the most negative reading in American history.
Foreign holdings of US Treasuries have fallen from 49% of outstanding in 2011 to 33% today.
Net investment income — the exorbitant privilege — has reached zero for the first time in fifty years.
The dollar index (DXY) remains elevated against fiat alternatives, still above its long-run average.
The dollar share of global reserves (COFER) has declined from 71% in 1999 to 57% today.
The dollar measured against gold has lost approximately 65% of its value since 2011, with most of that decline concentrated in the last 24 months.
The cumulative pattern is consistent. Each independent measurement points in the same direction.
This is the analytical case for paying attention to the external account. The cyclical data — GDP, inflation, employment — tells you where the economy is right now. The external account tells you where the system is. The cyclical data will dominate the next news cycle. The external account will dominate the next decade.
For the macro reader trying to navigate this environment, the external account is the leading indicator. Not because any single series predicts any specific outcome, but because the cumulative pattern reveals the structural constraints within which all cyclical outcomes will resolve. The Federal Reserve will continue to set interest rates. The Treasury will continue to issue debt. The administration will continue to make trade and tax policy. Each decision will be constrained by the configuration the external account describes.
History is suggestive but never determinative. The Dutch, the Spanish, and the British each had idiosyncratic features that distinguished their transitions. The American case has features no prior empire faced. Whether those features prove sufficient to alter the trajectory is the central question.
Three potential offsets are worth taking seriously.
The first is network effects. The dollar’s role as the global settlement currency creates demand for dollar liabilities that has no historical analog. For the American case to diverge from historical examples, those network effects would need to slow the COFER decline meaningfully below its current 50-basis-point annual pace. The trend has not yet shown that deceleration.
The second is military hegemony. The United States enforces the global trade settlement system in ways its predecessors could not. The signal to watch is whether countries historically forced into dollar settlement begin establishing parallel arrangements. Yuan-denominated oil trades with Saudi Arabia, BRICS settlement experiments, and Russian rerouting through ruble and yuan suggest enforcement is becoming harder, not easier.
The third is technological productivity. If AI-driven productivity growth raises potential GDP meaningfully — adding 1–2 percentage points to trend growth durably — the structural fiscal deficit becomes a smaller share of a faster-growing economy. This is the strongest of the three potential offsets because it operates on the denominator of the relevant ratios rather than on political dynamics around them. The early evidence is mixed.
The United States may still write a different ending. The structural arithmetic of the external account is what it is. The question is whether the offsets compound at sufficient scale and pace to alter the trajectory before the trajectory hardens into something irreversible.
What the data shows is what the data shows. The exorbitant privilege has reached zero. The net debtor position has reached historic extremes. The foreign demand share has eroded by a third. The dollar has lost roughly two-thirds of its value against gold. The composition of credit creation has become fiscally dominant. Each of these is a measurable shift in the structural arithmetic underneath the American economic system.
The unwinding is real. The slowness is what makes it easy to miss. What makes it easier still is that the system continues to function. Every day, dollar auctions clear. Treasury yields settle at levels the market will absorb. The dollar remains the global reserve currency. The American consumer continues to consume. The configuration appears stable — until you measure how it differs from where it stood fifteen years ago.
Ferguson once observed that empires often appear healthiest late in the cycle because the accumulated institutional structure continues functioning long after the underlying arithmetic has turned. The functioning is what makes the erosion invisible. The data is what makes it visible.
This essay has presented the data. The conclusions belong to the reader.
This essay is the second in a series. The first, “The Last Privilege,” argued that the net investment income subsidy supporting American economic life for fifty years has reached zero. A future essay will examine the operational mechanisms — Treasury market plumbing, the shadow liquidity system, and the basis trade — that translate these structural shifts into day-to-day market behavior.
An expert assessment. The only issue I can see in it, is that every stable fiat currency has depreciated against the value of gold in a very short period. This is not unique to the USD. It is not really the value of gold v the USD that matters, but what that change means. That is the key point you made, which is that central banks are choosing to other stores of value than the US dollar, and that matters greatly in both a financial and psychological sense.
For the US to correct this trajectory, a lot would need to change. For a start, there would need to be a shift from the hybrid social-capitalist credit system to a proper market based system. The former is where credit is socialised via central banks, and governments take the place of the market. This means private and public actors are not playing their role - acting as a 'fiduciary lens' is essential to efficient markets. It also means the debt created is socialised, whilst the gains are privatised - doesn't that strike you as an odd deal? That means those who have wealth get more, and the country is lumped with massive debts which the average person will eventually have to wear.
The structural deficits are a measure of the diminishing returns, caused by this phenomenon and the inefficiencies in price discovery and asset allocation. Any business in the private that operated this way would have a real problem. Having ‘kicked this can down the road’ for decades now, there are constraints on both tightening and easing becasue the gun powder is gradually running out. The only real way to correct this is for the market to punish governments by demanding significantly higher yields to lend to them. This is now happening, helped by inevitable inflation.
We have had 13-14 years of significant growth in markets, and historically, this has been followed by 20 or so years of consolidation. The result IMO will most likely be a recession proportional to the extent of the problem. I'm looking to 2028 as the key culmination of this and the beginning of that period.