
The High Floor
Why the disinflation everyone is counting on was a borrowed glut — and how to trade the gap.

MACRO & MARKETS · JUNE 2026
There is a comforting story the bond market is telling itself. Inflation spiked, the Federal Reserve responded, and the long arc is bending back toward two percent. The ten-year breakeven sits near 2.3%. Shelter, the great driver of the post-pandemic surge, has cooled from seven percent to the low threes. The fever, on this telling, is breaking.
The story is wrong in a specific and important way. The disinflation of the last two years was not the economy healing. It was a one-time, debt-financed glut of apartments masking a structural shortage — anesthesia, not a cure. And the anesthesia is wearing off.
To see why, you have to stop looking at inflation as a single number and start looking at it as a basket of very different things, each governed by its own supply and demand. When you do, the case for a higher floor stops being a forecast and becomes something closer to arithmetic.
THE GLUT WAS THE ANESTHESIA
Shelter is roughly a third of the Consumer Price Index — the single heaviest component, and as of May 2026 it is still rising 3.4% a year, well above the Fed’s overall 2% target. So the path of inflation is, to a first approximation, the path of shelter. And the path of shelter over the last two years has been dominated by one region: the Sunbelt.
Between 2020 and 2022, near-zero interest rates and cheap construction financing set off the largest apartment-building boom since the 1980s, concentrated in the high-growth metros of Texas, Arizona, the Carolinas, and the Mountain West. Those projects took two to three years to build. They arrived, all at once, into 2024 and 2025 — a record wave of new supply hitting the market just as demand normalized.
The result was a renter’s paradise and a landlord’s recession. Asking rents went negative across the region: Austin down more than three percent year over year, Denver down three, Phoenix and Las Vegas down two and a half. Landlords in Texas began offering ten to twelve weeks of free rent to fill units; more than half of Phoenix listings now advertise at least a month free.
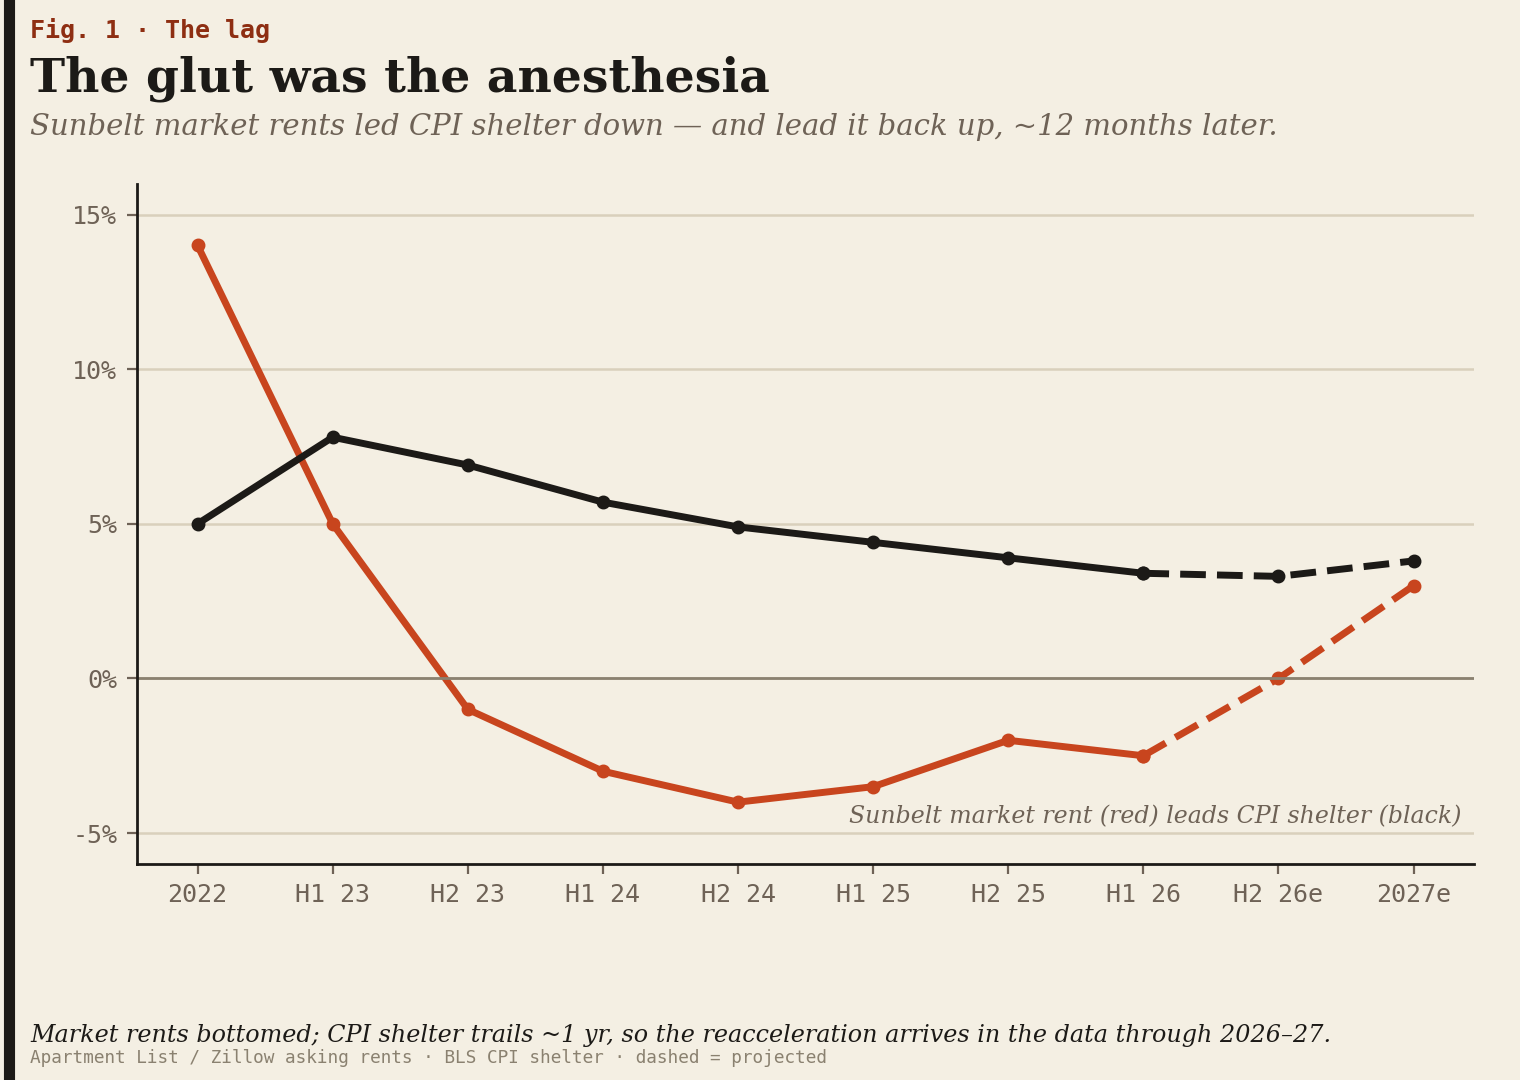
That regional collapse is what dragged national shelter inflation down from its peak. It looked like the economy healing. It was a supply glut — and supply gluts, unlike structural shifts, are temporary by definition.
THE CURE WAS NEVER BUILT
Here is what the glut concealed. The United States is short somewhere between one and a half and four million housing units, depending on whose methodology you trust. That deficit is the product of more than a decade of underbuilding since the financial crisis, and it does not respond to price the way textbook supply is supposed to.
The reason is that housing supply is governed by permission, not by price signals. The binding constraints are zoning, permitting timelines that run eighteen to thirty-six months in major metros, construction labor that never returned after 2008, and material costs inflated by tariffs. When rents rise, you cannot simply build more apartments next quarter. You can build them in three years — if the zoning allows, if the financing pencils, if the labor exists.
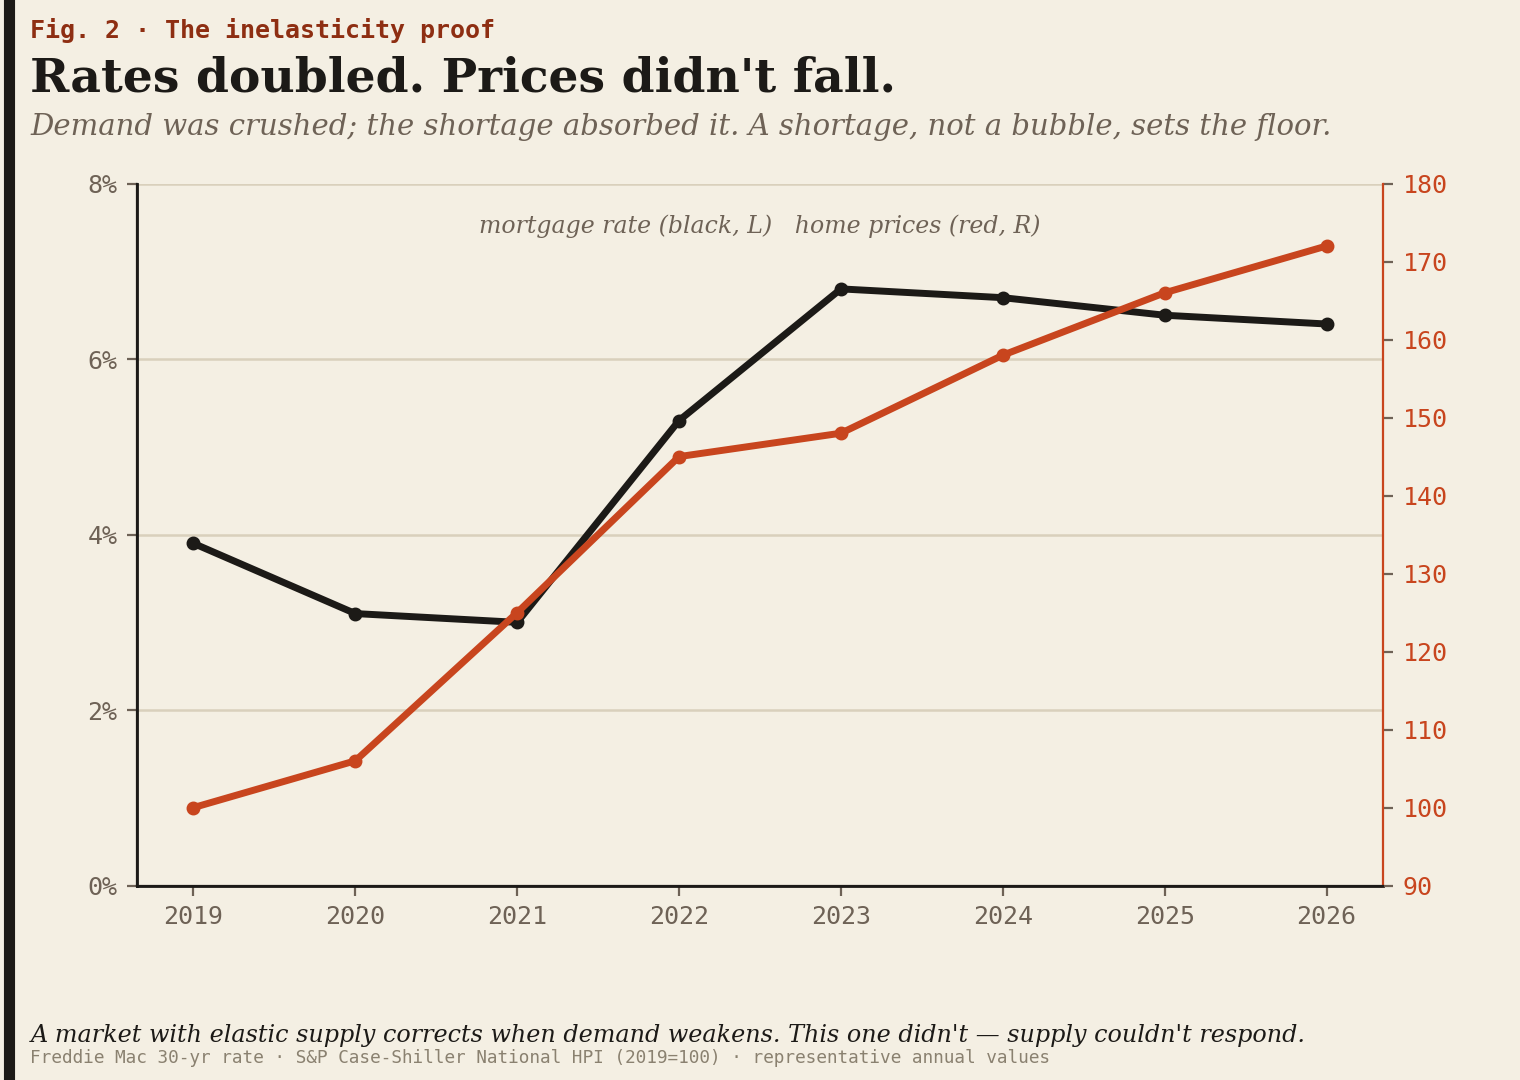
You can watch this inelasticity in the cleanest possible test: mortgage rates more than doubled, demand cracked, and home prices and rents still did not meaningfully fall. The shortage absorbed the blow. A market with elastic supply corrects when demand weakens. This one didn’t — because the supply isn’t there to correct with.
So the glut and the deficit were running at the same time, in tension. The cyclical glut of brand-new Sunbelt apartments pushed rents down. The structural deficit held them up. For two years, the glut won, and the country got disinflation. The question that decides the next two years is what happens when the glut clears and the deficit is the only force left standing.
WHAT HAPPENS WHEN THE DOSE RUNS OUT
The building boom is already over. It just hasn’t shown up in rents yet.
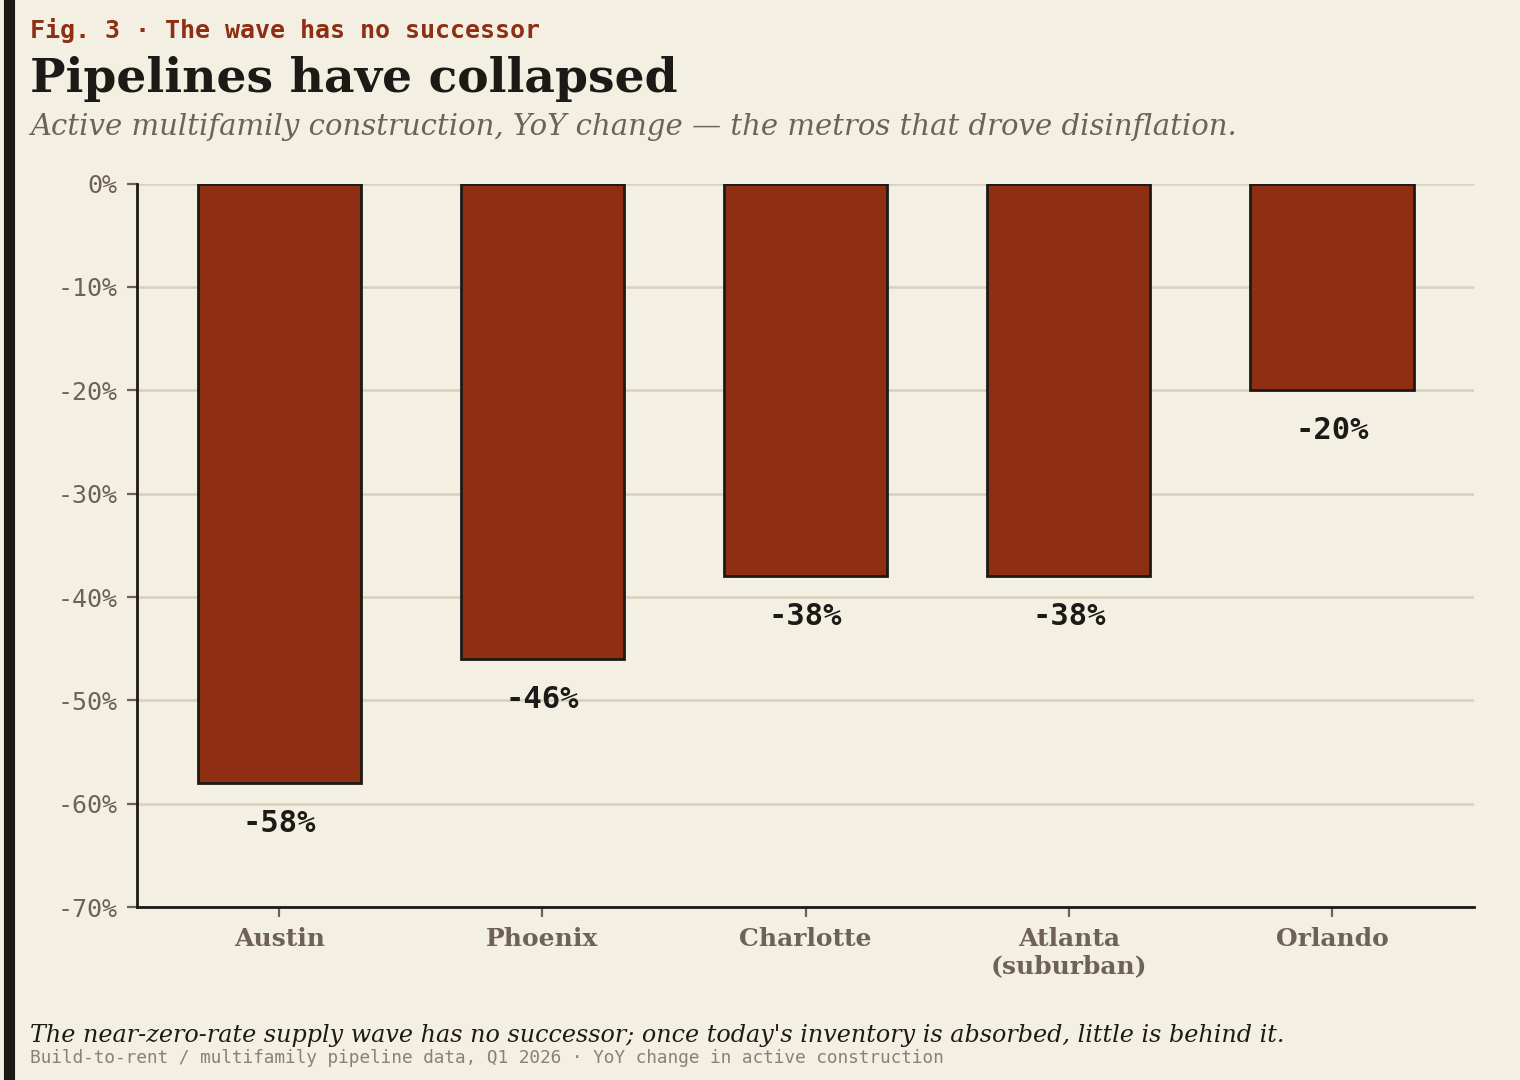
Construction pipelines have collapsed across exactly the markets that drove the disinflation: active development down roughly fifty-eight percent in Austin, forty-six percent in Phoenix, thirty-eight percent in Charlotte. Nationally, multifamily units under construction have fallen by more than half from their 2023 peak. The wave that flooded the market in 2024–25 has no successor. Once the existing unleased inventory is absorbed, there is very little behind it.
The industry sees the turn coming. Analysts expect pricing power to shift back to landlords within twelve to eighteen months as concessions burn off. The Dallas Fed’s own researchers project a resumption of rent growth in late 2026 and 2027 as deliveries moderate against steady demand. The metros that are negative today — Dallas, Atlanta, the Carolinas — are expected to cross back toward positive first.
And here is the mechanism that makes this matter for inflation specifically: the CPI’s measure of shelter lags market rents by roughly twelve months, because it averages across all existing leases, not just new signings. That lag cut both ways. It delayed the glut’s disinflation, and it will delay the reacceleration. Which means the turn in market rents that is beginning now lands in the official inflation data in late 2026 and through 2027 — precisely the window in which the bond market has priced shelter to keep cooling.
When the glut clears, you do not return to neutral. You return to the structural deficit that was there the whole time, waiting underneath.
ADD UP THE PARTS
Step back from shelter to the whole basket and the same pattern repeats: the components that are cooling are cyclical and reversible; the components that are sticky are structural and supply-constrained.
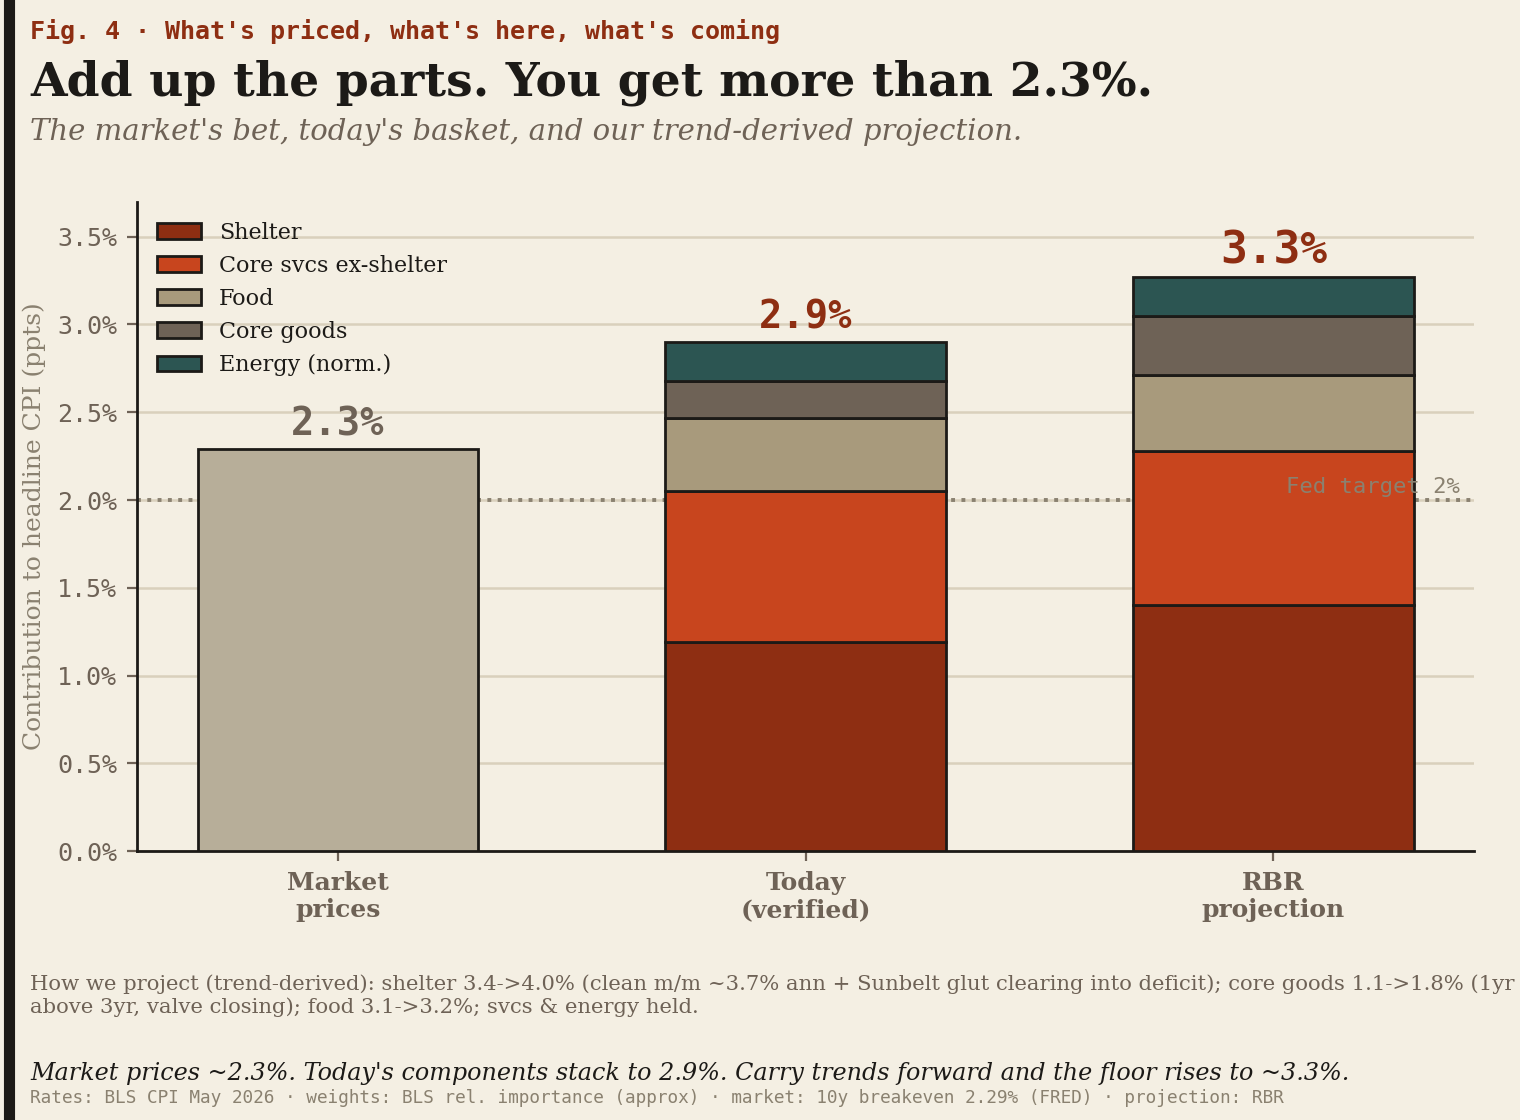
Price each piece of the May 2026 basket at what it is actually doing. Shelter contributes about 1.2 points to headline inflation (3.4% times its ~35% weight). Core services outside shelter — wage-driven, never negative in four decades — add another 0.9. Food adds 0.4. Even with core goods still deflating and energy held at a normalized 3%, the parts stack to roughly 2.9%. The market has priced 2.3%.
How we project (trend-derived, not assumed):
Each forward number reads the component’s 1-yr, 3-yr, and latest monthly pace. Shelter 3.4→4.0% (clean monthly pace ≈3.7% annualized + Sunbelt glut clearing into a structural deficit). Core goods 1.1→1.8% (1-yr already above 3-yr — turning up off the floor as the import-deflation valve closes). Food 3.1→3.2%. Services and energy held. The shelter bar is the floor under the whole estimate.
The market prices ~2.3%. Today’s verified components already stack to 2.9%. Carry the trends forward and the floor rises to ~3.3% — a full point above what’s priced, with shelter doing most of the work.
Now carry the trends forward, the way a credit underwriter reads a borrower. Shelter’s clean monthly pace already annualizes near 3.7%, before the Sunbelt turn adds to it. Core goods, still negative month to month, has a one-year rate already running above its three-year rate: it is turning up off the floor as the import-deflation valve closes. Run those forward and the basket implies a floor closer to 3.3% — a full point above what is priced, with shelter doing most of the work.
That is the part the comforting story misses. Roughly two-thirds of that floor is shelter plus wage-driven services — both resting on supply that has gone physically rigid, and neither reachable by the only tool the central bank has, which works on demand. The Federal Reserve can crush demand. It cannot zone an apartment, reopen a refinery, or summon a generation of construction workers who left the trade fifteen years ago.
THE HONEST RISK
A thesis worth holding is one that can be proven wrong, so it is worth being precise about what would break this one.
The reacceleration requires demand to hold. A clearing glut only pushes rents back up if people are still forming households to fill the units. If a recession — or the white-collar displacement now visible in the data, much of it concentrated in the same Sunbelt boomtowns that absorbed the supply — hits employment in Austin, Dallas, and Charlotte, the glut clears for the wrong reason: inventory empties because demand never came, and rents stay soft despite the vanished pipeline. This is the genuine bear case, and serious analysts hold it: Cohen & Steers, for one, expects weaker demand from a shrinking renter-age cohort to keep rent growth pedestrian even as supply subsides.
So the watch items are clear and falsifiable. If Sunbelt asking rents cross back to positive year over year — starting with Dallas and the Carolinas — the floor is reasserting on schedule. If Sunbelt employment and migration roll over while vacancy stays elevated, the demand side has broken and the disinflation extends. The next four quarters of regional rent and jobs data will settle it.
THE TRADE: LONG THE GAP, PAID TO WAIT
If the floor is 3.3% and the market has priced 2.3%, the cleanest expression is not a stock or a sector. It is the gap itself: inflation breakevens, and their components.
A breakeven is the difference between a nominal Treasury yield and the real yield on an inflation-protected one (TIPS) of the same maturity — the inflation rate at which owning the two leaves you indifferent. Buy the breakeven (long TIPS, short the matching nominal) and you profit if realized inflation runs above the priced rate. At ~2.3% on the ten-year and ~2.6% on the five-year, you are being asked to bet that inflation averages below 3% for a decade — in a world where it is printing 4.2% today and the largest single component is about to re-accelerate.
The structure has three features that make it more than a directional inflation bet. It’s cheap insurance, not a stretched long — breakevens sit near their historical band even after the recent energy move, and the five-year’s fifteen-year average is under 2%. It has a catalyst with a clock — the ~12-month lag means the Sunbelt rent turn already happening in market data has to show up in CPI shelter through late 2026 and 2027; you are not waiting for a forecast to come true, you are waiting for data already in the pipeline to surface, and you get carried while you wait. The asymmetry favors the buyer — if the demand-side bear case wins, breakevens drift modestly lower and the loss is contained; if the floor reasserts, the repricing from 2.3% toward 3%+ is a multiple of that. You risk the carry; you make the regime shift.
The expression scales: the five-year breakeven for the cleaner read on the near-term shelter catalyst; the ten-year if you want to bet the resting rate has reset and the market’s long-run anchor is simply too low. The position works best entered before the shelter data turns — by the time CPI shelter visibly re-accelerates, the breakeven will have moved.
NOT A LONELY TRADE
This is contrarian against market pricing but not against the people who move the most capital — the comfortable place for a thesis to sit. Through early 2026, the largest managers were quietly positioning the same way: BlackRock’s tactical fund shorting long-dated Treasuries on the view that growth and commodities keep upward pressure on prices; PIMCO preferring TIPS as cheap inflation insurance precisely because near-term reacceleration risk is real while long-term breakevens stay low; Bridgewater arguing the resting rate of inflation has reset higher and that protection is underpriced. Lazard’s chief executive has called U.S. inflation back above 4% by year-end the most likely scenario. The breakeven market itself has begun to register it, with near-term measures rising faster than long-term ones — conceding the near-term shock while still betting on a return to anchor it has not earned.
The disagreement, then, is narrow and specific. Almost everyone admits inflation is sticky. The market still prices it reverting to roughly 2% over the medium term. The bet is that it can’t — because the two largest pieces of the basket sit on supply the Fed cannot reach, and the largest of those, shelter, is about to turn from the thing pulling inflation down into the thing holding it up.
The fever didn’t break. The dose ran out.
NO TAUNTS. NO THEATRICS. JUST THE TAPE.
Breakevens are priced off of nominal not core cpi, so returns are mostly driven by change in price of oil, not rent. Run principal component analysis to validate. Therefore, u are not buying rent, rather change in price of oil vs today’s price . Good luck predicting that…
Nice analysis.